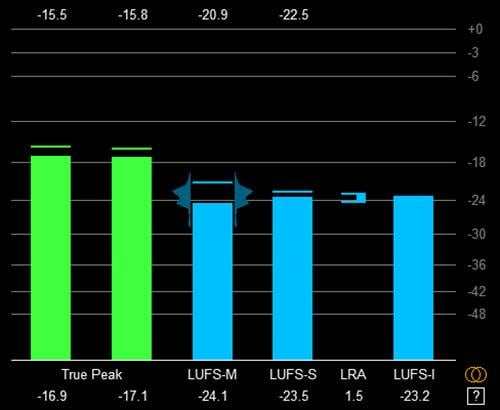
In this article, we will look at the substance of the loudness normalization established by the ITU. I believe that modern DAWs have loudness meters built in. The figure below shows the loudness meter included with the DAW Reaper.
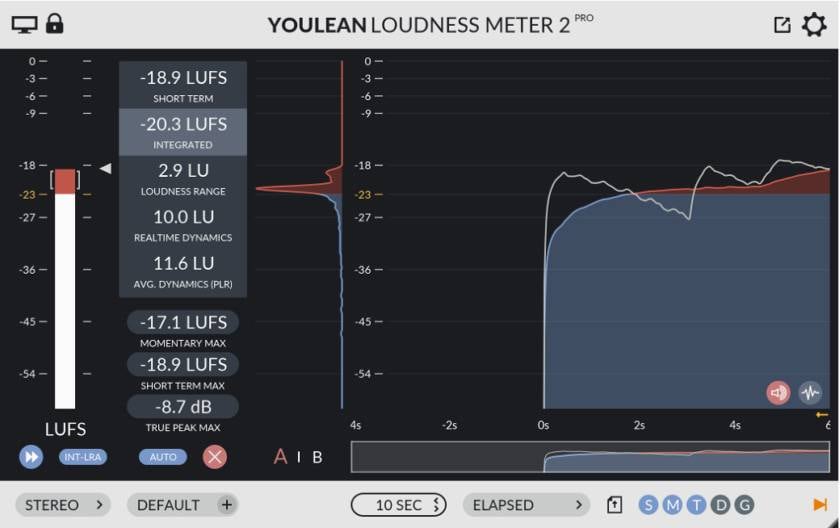
Even if your DAW does not have a loudness meter, there are excellent free loudness meter plug-ins available, such as Youlean Loudness Meter, so you should have no trouble getting one.
The loudness meter consists of several meters, as shown below. First you need to know what these mean.
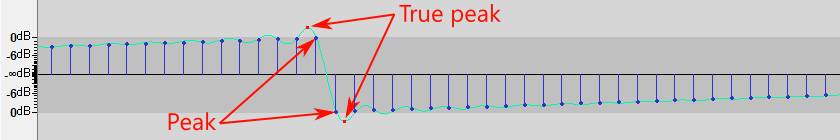
True Peak
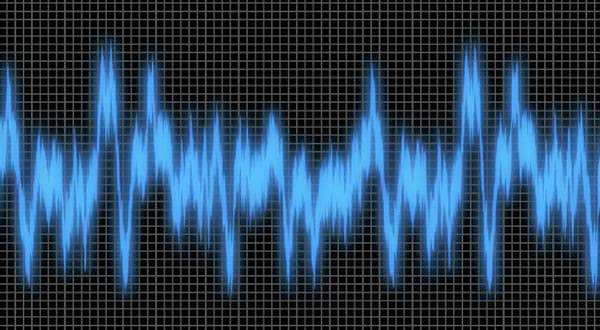
This looks at the instantaneous maximum value of the waveform, but instead of the actual sample level, it calculates the maximum level including the time between samples. As shown in the figure below, even though each sample on the blue bar does not exceed 0 dB, when the waveform is oversampled or otherwise made into an ideal analog waveform (green), the values between samples may exceed 0 dB.
LUFS-M (Loudness Unit Full Scale Momentary)
Outputs RMS values for 400 ms (milliseconds) after passing through the filter. There is no refresh (display frequency) specification, but it is recommended to be 10 times or more per second. This means that the smoothness of the movement may vary from meter to meter. The figure below shows the LUFS-M image when outputting LUFS-M to the waveform, which calculates 400 ms in order from No. 1 and continues to output LUFS-M every 100 ms. It can be expressed as an overlap of 75%.
Therefore, the response of the meter is close to that of a VU meter, and although it is slow, it can be said to be close to human perception range. The waveform below is the rhythm section. 400 ms is the length of time between the peak and the minimum value, so you can understand that the output volume is rather slow. In particular, the loudness meter is filtered, so it is less affected by bass than the VU meter, which is closer to human perception range.
In the case of the figure below, the meter calculates and outputs every 100 msec, which means that the meter moves at 10 frames/second. This is a frame rate at which we cannot expect very smooth motion. If you want a smooth display, you need to increase the number of refresh cycles, but the CPU load will increase. Personally, I want my meters to be as smooth as possible.

LUFS-S (Loudness Unit Full Scale Short-term)
Outputs RMS values for 3 seconds after passing through the filter in the same way. The recommended refresh time is 100ms or longer, the same as Momentary. Personally, I do not think that less than 100ms is acceptable, since it is not required to be as smooth as Momentary. The figure below shows the LUFS-S image when the same waveform as above is refreshed every 500 ms.

LRA (Loudness Range)
This meter shows the main range of LUFS-S. By looking at this, the approximate size of the range can be grasped.
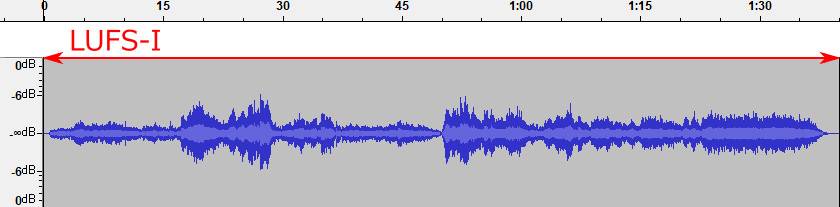
LUFS-I (Loudness Unit Full Scale Integrated)
This is the loudness value of the entire measurement range (the entire song) after passing through the filter, but it differs significantly from the others in that it is gated.
Algorithm
There are a few things to note about the readings. First, we will look at the algorithm (signal flow) proposed by the ITU. It is surround compatible. There are two parts: one part is calculated for each channel, and the other part is calculated by the sum. In the case of music, we usually use only the top two channels, since they are stereo 2-channel, and go through the K-filter and into the mean square. This means the RMS calculation. Each channel is then merged and Gate is applied to LUFS-I only. This is important to note.

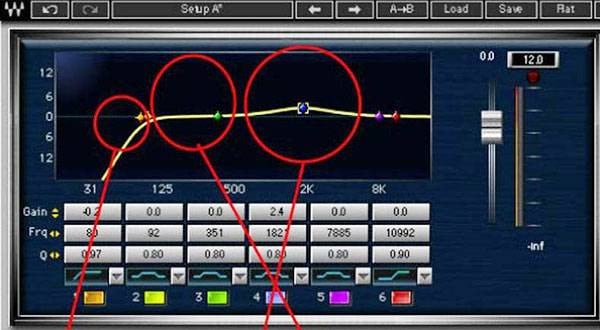
There is also an unfamiliar filter called K-filter, which is a frequency-weighted characteristic, and its special trait looks like this.
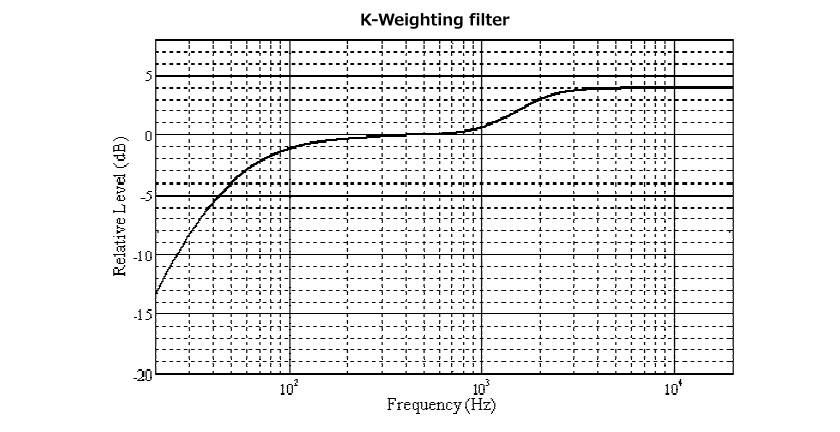
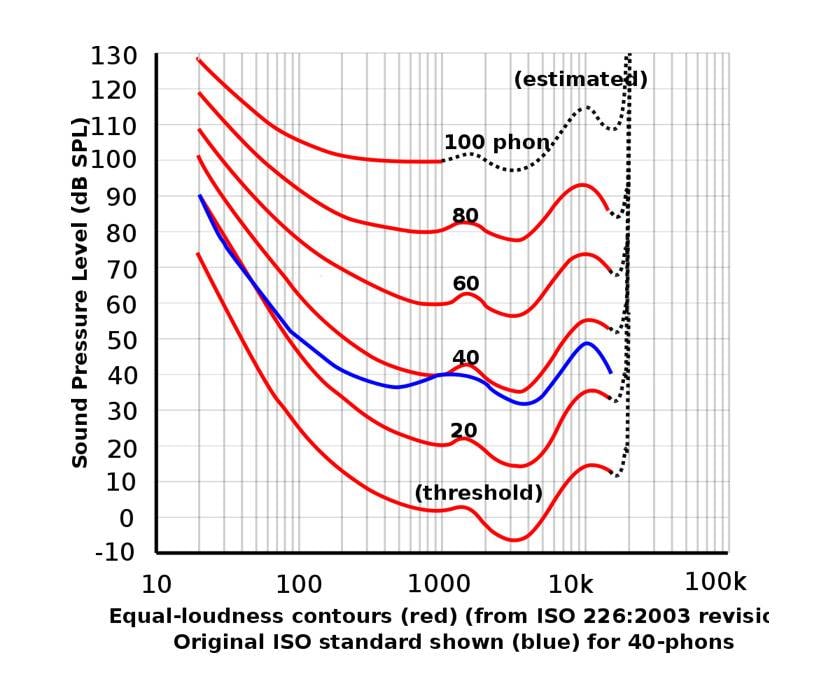
In other words, this is what you would call an equal-loudness curve. The real equal loudness curve is as follows. The human auditory sense is that there are variations in sensitivity at different frequencies, depending on the volume. It varies greatly with loudness. The graph is the sensitivity, so it is an inverse relationship.
Those formulated by the ITU do not take volume differences into account. Also, the low frequencies are close to the loudness curve, but above 3 kHz is constant. My personal impression is that it is a bit messy to call it loudness. In fact, loudness varies with the user's environment, so it would be too complicated a story to take into account everything from low volume to loud explosions. It is also not very realistic to trace the loudness curve accurately. In reality, it needs to be as simple as possible, since it must take into account various hardware, software, and things of that nature.
Perhaps the volume is intended for general home use because the volume range was narrowed down. Once the volume range was determined, I think we came to the conclusion that a fixed K-filter would be sufficient. What is important is to have a moderate cutoff of bass and a peak around 2 to 4 kHz. Also, it should be noted that the K-filter treats the area around 10 kHz as highly sensitive, although the sensitivity of this area is normally reduced.
In the next issue, we will examine the K-filter and explain the remaining blocks of the algorithm.
The “sound & person” column is made up of contributions from you.
For details about contributing, click here.


![[The Ultimate Next-Generation Mastering Tool] iZotope Ozone 11 is Absolutely Amazing!!](/contents/uploads/thumbs/2/2023/10/20231004_2_24113_1.jpg)
![[Effortlessly improve the sound quality!] Mastering the Plug-in iZotope](/contents/uploads/thumbs/2/2021/4/20210426_2_12730_1.jpg)
 定番DAWソフトウェア CUBASE
 iZotopeが手がけるオールインワンDAW “Spire”
 DTMセール情報まとめ
 USB接続MIDIインターフェイス
 DTMに必要な機材
 DTM・DAW購入ガイド